
September 2026
The Bond Market Speaks Up
August was a good month for stocks. The S&P 500 rose 2.7% — its best August since 2021 — snapping two months of declines, while the Dow posted a fifth straight winning month. Technology led the way, up more than 6%, with software stocks rebounding 16%. One detail worth noting: the largest technology companies lagged the other 493 companies in the index, a reversal of the pattern that dominated the past few years.
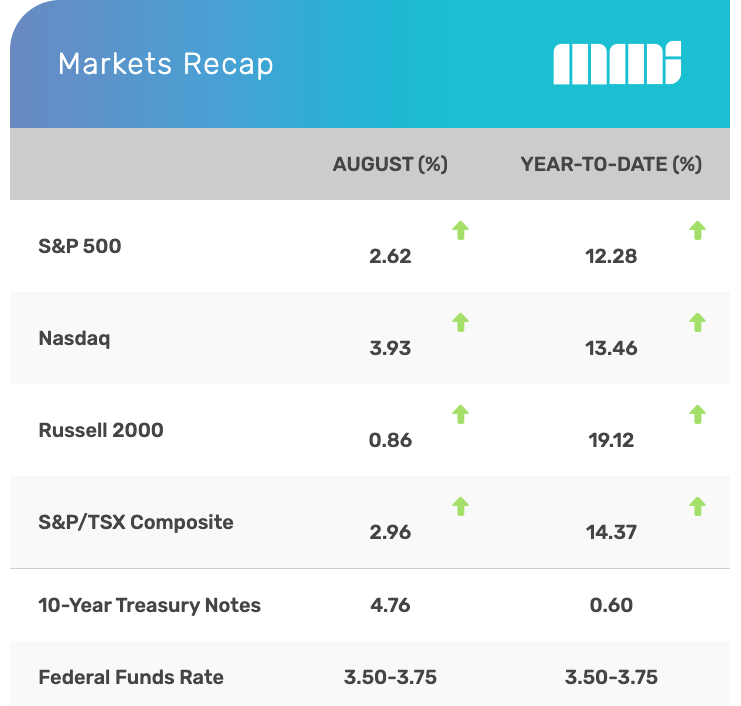
The more consequential story was in bonds. The 10-year Treasury yield climbed to roughly 4.85%, its highest since October 2023, and 30-year yields reached multi-decade highs. Several forces are pushing the same direction — higher oil prices from the conflict with Iran feeding into inflation, a record wave of corporate borrowing and foreign buyers stepping back. Most bond market participants now expect the 10-year to cross 5% before year end.
That backdrop set up the month’s biggest surprise. Speaking at the Fed’s annual Jackson Hole conference in late August, Chair Kevin Warsh delivered a notably hawkish message, saying this summer’s improved inflation readings don’t yet show that the underlying trend has genuinely turned. Before the speech, markets put roughly 70% odds on the Fed leaving rates alone in September. Afterward, a quarter-point increase became close to a coin flip.
A rate hike would be a genuine shift after two years of cuts and holds — but rising yields aren’t purely bad news. Existing bond holdings do lose value when yields climb, and that stings. Yet every new dollar invested in bonds today earns meaningfully more than it did a few years ago, and savers are finally paid to wait. Higher borrowing costs also tend to cool the most speculative corners of the market first, which is exactly where valuations have run hottest.
In your portfolio, diversification across the broad market continued to serve you well — August rewarded the average stock over the giants, and the equal-weighted exposure in our models captured precisely that. On the bond side, we shortened duration across our models in late July. Duration is simply a measure of how sensitive a bond is to interest rates: the longer it is, the more the price falls when yields rise. Given where rates are headed, we would rather carry that risk in smaller size. What we won’t do is reposition around a single Fed meeting.
Please never hesitate to reach out with questions about how any of this affects your portfolio. We remain focused on managing risk while preserving and growing your capital over the long term.
-The Axiom Team
U.S. and Canadian Markets
Renewed enthusiasm for AI pushed stocks higher in August as investors looked past mixed economic signals. The Standard & Poor’s 500 Index advanced 2.62 percent, while the Nasdaq Composite rose 3.93 percent. The Dow Jones Industrial Average lagged, adding 1.34 percent. The S&P/TSX rose 2.96 percent.1,2
Strong Start
Stock prices opened the month higher thanks to diplomatic efforts in the Middle East. Big Tech helped pace the rally, further boosted by strong Q2 corporate reports. Investors seemed to believe that a soft job market update could influence the Fed’s outlook for short-term rates.3,4,5
Mid-Month Malaise
Markets then traded in a sleepy summer trading range for the next several weeks as investors’ attention shifted between economic reports and activity in the bond market.6,7
A-I Led Rally
Over the last full week of the month, the three major averages looked past a slightly warmer-than-expected inflation report and focused on upbeat AI-related Q2 corporate reports, which rekindled positive market sentiment. Semiconductor stocks and adjacent names in the AI trade led the rebound, driving broader gains for the Nasdaq and S&P 500.8,9
U.S. Sectors
Seven of the 11 S&P 500 Index sectors advanced in August.10
Energy (+7.4 percent) led the pack for the second month in a row, along with Information Technology (+6.4 percent). Consumer Discretionary (+0.4 percent), Communication Services (+3.0 percent), Health Care (+4.9 percent), Materials (+4.5 percent), and Financials (+1.4 percent) finished the month higher.10
Consumer Staples (-0.1 percent), Industrials (-2.6 percent), Real Estate (-2.1 percent), and Utilities (-4.8 percent) were under pressure.10
Canada Recap
The S&P/TSX Composite Index notched a solid gain in August, powered by stronger bank earnings and better-than-expected gross domestic product (GDP) data.11
Mining stocks set the pace, setting off a string of record closes for the TSX during the month. Energy stocks rallied as investors focused on higher oil prices amid Strait of Hormuz-related supply concerns.12,13
A stronger-than-expected Q2 GDP report added to the rally, though the index gave back some ground late in the month as energy and technology stocks came under pressure.14,15,16
What Investors May Be Talking About in September
Investors will be keeping close tabs on consumer trends in September.
Retail sales have generally declined over the past six months, putting greater focus on the consumer spending engine that generates two-thirds of U.S. economic growth.17
Any update on the consumer that exceeds or misses a forecast can generate a reaction from Wall Street. Retail reports tend to provide insights into how consumers are navigating the economic crosscurrents of inflation, the job market, and an uncertain rate outlook.
World Markets
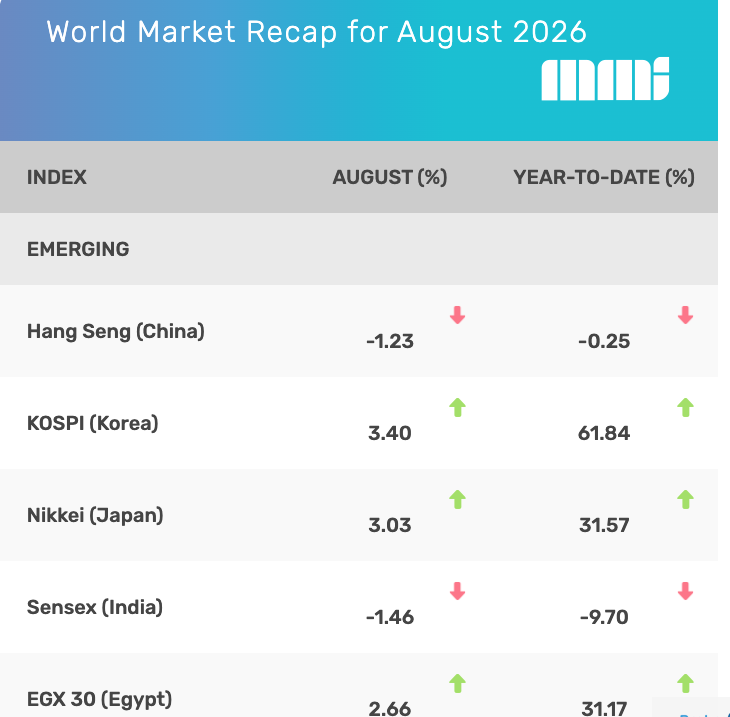
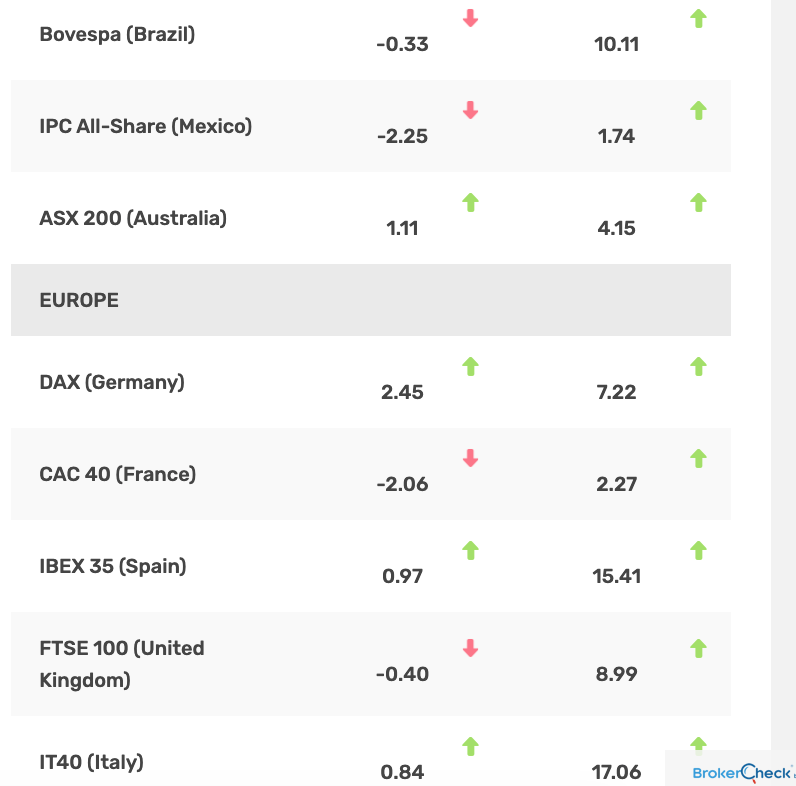
The MSCI EAFE Index rose 1.80 percent in August, thanks to pockets of strength throughout the world.18,19
Europe was mixed, with Germany (+2.45 percent) leading, with Spain (+0.97 percent) and Italy (+0.84 percent) not far behind. France (-2.06 percent) and the United Kingdom (-0.40 percent) were under pressure.19
Markets outside of Europe were more mixed, too. India fell 1.46 percent while Egypt added 2.66 percent.19
It was the same “mixed market” story in the Pacific Rim. Japan (+3.03 percent) and Australia (+1.11 percent) were among the best performers, while Hong Kong (-1.23 percent) was under steady pressure. Korea picked up 3.40 percent, bringing its year-to-date gain to 61.84 percent.19
Yahoo Finance August 31, 2026
Indicators
Gross Domestic Product (GDP)
The economy grew 1.5 percent in Q2, unchanged from the Commerce Department’s initial estimate. Solid consumer spending and AI infrastructure investment remained primary drivers of Q2 growth.20
Employment
Employers shed 23,000 jobs in July, missing expectations for an 83,000-job gain. July’s decline was the first monthly contraction in the labor market since February. The unemployment rate in July edged down to 4.1 percent from 4.2 percent in June. Year-over-year wage growth rose 3.2 percent, just short of the 3.4 percent expected.21,22
Retail Sales
Retail sales fell 0.6 percent in July over the prior month. Economists were expecting a 0.1 percent increase. Year-over-year retail sales increased 5.0 percent in July, easing from June’s upwardly revised 6.8 percent rise.23,24
Industrial Production
Industrial output advanced a modest 0.2 percent in July over the prior month, slightly lagging market expectations for a 0.3 percent increase and just behind June’s upwardly revised 0.3 percent gain. Year over year, industrial production rose 1.1 percent, slowing from June’s upwardly revised 1.3 percent gain.25
Housing
Housing starts unexpectedly dropped 12.4 percent in July over the prior month, reflecting weak homebuilder sentiment as rising construction costs, still-elevated mortgage rates, and economic uncertainty took a toll. The drop follows June’s 19 percent jump.26,27
Sales of existing homes fell 1.7 percent in July over the prior month to 4.06 million units, down from June’s 1.4 percent drop. The median existing home sales price rose 2 percent to $434,100 from a year earlier, the second-highest median price on record after June’s $442,800 median price. The inventory of unsold homes fell 1.9 percent in July over the prior month to 1.54 million units, equal to 4.6 months of supply at the current sales rate.28,29
Sales of newly constructed, single-family homes unexpectedly dropped 10.5 percent in July from the prior month to 607,000 homes. Regionally, month-over-month sales rose 30.3 percent in the Northeast and 6.2 percent in the West but declined 13 percent in the South and 42.7 percent in the Midwest.30
Consumer Price Index (CPI)
Inflation rose 0.1 percent in July over the prior month, as expected, after June’s 0.4 percent decline. Core CPI, which excludes energy and food, rose 0.2 percent in July over the prior month as expected, up from June, when month-over-month core prices remained unchanged. Year-over-year CPI rose 3.4 percent as expected, cooling slightly from June’s 3.5 percent annualized rise. Core CPI increased 2.5 percent in July over the prior 12 months, down slightly from 2.6 percent in June.31,32
Durable Goods Orders
Orders of manufactured goods designed to last three years or longer increased 1.1 percent in July, more than doubling market expectations.33
The Federal Reserve
While there was no official Federal Open Market Committee (FOMC) meeting in August, some would argue that one of the most important Fed meetings of the year took place in Jackson Hole, Wyoming.
It’s the Fed’s annual Economic Policy Symposium, which took place August 27-29. Each year, investors look for clues about where the Fed thinks the economy is headed over the long term. It was at Jackson Hole that then-Fed Chair Jerome Powell surprised investors in 2023 with his “higher for longer” interest rate message.34,35
Fed Chair Kevin Warsh, who believes less is more when it comes to the Fed communicating about future policy moves, made it clear to attendees that inflation remains his primary focus. “We must be confident that underlying inflation is moving to our objective, clearly and at sufficient speed. Otherwise, we have work to do. That’s our job . . . our mandate . . . and our charge to keep,” said Warsh.34
The next official FOMC meeting is September 15-16.
Copyright 2026 FMG Suite
1. WSJ.com, August 31, 2026
2. TMX.com, August 31, 2026
3. CNBC.com, August 4, 2026
4. CNBC.com, August 6, 2026
5. WSJ.com, August 7, 2026
6. CNBC.com, August 12, 2026
7. CNBC.com, August 13, 2026
8. CNBC.com, August 27, 2026
9. WSJ.com, August 28, 2026
10. SSga.com, September 1, 2026
11. TMX.com, August 4, 2026
12. TMX.com, August 13, 2026
13. Yahoo Finance, August 14, 2026
14. Statistics Canada, August 28, 2026
15. TMX.com, August 31, 2026
16. TradingEconomics.com, August 31, 2026
17. USBank.com, August 18, 2026
18. WSJ.com, August 31, 2026
19. MSCI.com, August 31, 2026
20. WSJ.com, August 26, 2026
21. WSJ.com, August 7, 2026
22. TradingEconomics.com, August 7, 2026
23. WSJ.com, August 14, 2026
24. TradingEconomics.com, August 14, 2026
25. KPMG.com, August 18, 2026
26. WSJ.com, August 18, 2026
27. TradingEconomics.com, August 18, 2026
28. WSJ.com, August 11, 2026
29. National Association of Realtors, August 11, 2026
30. Realtor.com, August 25, 2026
31. WSJ.com, August 12, 2026
32. TradingEconomics.com, August 12, 2026
33. KPMG.com, August 27, 2026
34. WSJ.com, August 28, 2026
35. CNBC.com, August 25, 2023
Axiom Financial Strategies Group, LLC (“Axiom”) is a registered investment advisor. Advisory services are offered through Axiom. Securities are offered through Lion Street Financial, LLC (“Lion Street”). Axiom and Lion Street are not affiliated. Advisory services are only offered to clients or prospective clients where Axiom and its representatives are properly licensed or exempt from licensure.
Registration as an investment adviser does not imply a certain level of skill or training. Information about Axiom Financial Strategies Group, LLC can be found by visiting www.adviserinfo.sec.gov and searching by the adviser’s name. This is prepared for informational purposes only. It does not address specific investment objectives. Information in these materials are from sources Axiom Financial Strategies Group, LLC deems reliable, however we do not attest to their accuracy.
The views expressed in this commentary are subject to change based on market and other conditions. These documents may contain certain statements that may be deemed forward-looking statements. Please note that any such statements are not guarantees of any future performance and actual results or developments may differ materially from those projected. Any projections, market outlooks, or estimates are based upon certain assumptions and should not be construed as indicative of actual events that will occur.
The information herein was obtained from various sources. Axiom does not guarantee the accuracy or completeness of information provided by third parties. The information in this report is given as of the date indicated and believed to be reliable. Axiom assumes no obligation to update this information, or to advise on further developments relating to it. Links provided to other websites are not under our control and we are not responsible or liable for the contents of any linked site or any link contained in the linked site. We do not endorse or guarantee and are not responsible or liable for the failure of the products, information, or recommendations provided by linked sites.